What is Hikinashi Candle?
Hikinashi candles are useful candles for determining trends as they reduce candle noise. It shows the trend more clearly by redefining the high and low points, opening and closing prices of candles. The formula is as follows.
close = (open + close + high + low) / 4 open = (previous open + previous close) / 2 # Median value of the previous bar high = max(open, close, high) low = min(open, close, low)
It may seem complicated, but it is not difficult to understand if you look at it slowly. The opening price is the midpoint between the opening and closing prices of the previous candle, The closing price is the average of all candle values of the current candle. The highest and lowest prices are literally the highest and lowest prices, The reason the formula includes the opening and closing prices is because the definition of the opening price is the midpoint of the previous bar.
Because Haikinashi does not directly reflect the passage of time. There may be cases where the market price of Hikinashi exceeds the high price of a regular candle.
Hikinashi candle example
Let's look at the example below. I compared Tesla (ticker: TSLA) charts on a site called Webull.
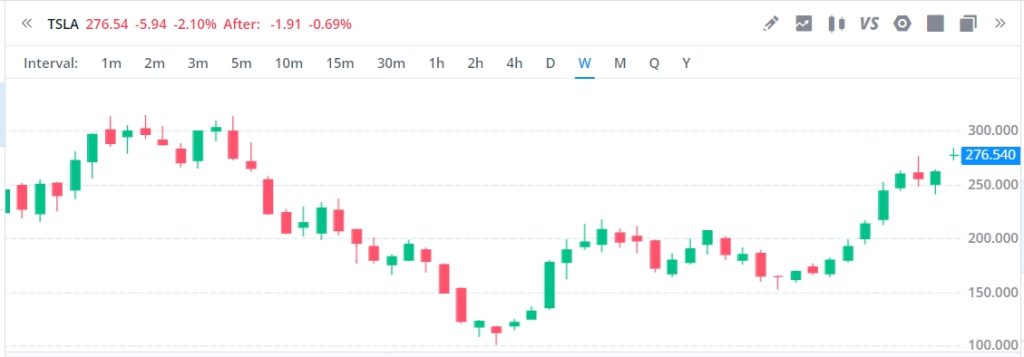 TSLA general candle chart (weekly candlestick)
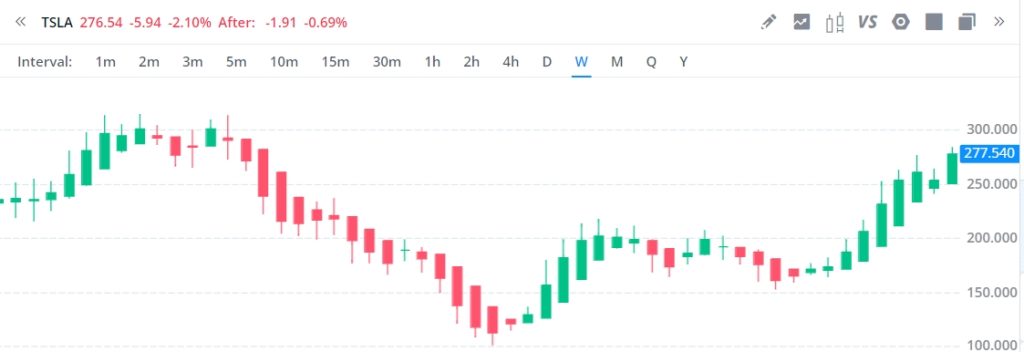 TSLA Hikin Ash candle chart (main candlestick)
There certainly seems to be less fluctuation, and the trend has become clearer. What is it like? Don’t you think it will definitely help you figure out direction?
How to use Hikinashi candle
In general, the longer the body of the Hikinashi candle, the more evident the trend is. If the body is short and the tail is long, it heralds a change in trend.
Therefore, buy when the ratio of the tail to the body of the previous bar is below a certain percentage, You could consider selling when the percentage exceeds a certain level.
ex) Based on Hikinashi candle |(open - close)|/(high - low) > 80% → Buy |(open - close)|/(high - low) < 20% → Sell
The above is just an unverified example based on the Haikinashi concept. Use it only to understand the concept, If you want to use it for actual trading, be sure to undergo thorough prior verification.
What are the disadvantages of Hikinashi?
As mentioned earlier, it does not reflect the actual flow of time. This is the biggest blind spot of the Hikinashi chart.
Because you can’t even tell the current price just by looking at the chart. It should only be used as a single indicator such as moving average or RSI. Use only Hikinashi candles as an entry condition or You should not attempt to replace candle charts for market analysis.
Python code for practical use
Using Python, you can verify trading methods or automate trading. You can use the concept of Heikinashi. Below is the code that converts the df of a general candle chart to Hikinashi.
def heikinashi(close, open, high, low): df = DataFrame() df['haclose'] = (close + open + high + low) / 4 df['haopen'] = (open.shift(1) + close.shift(1)) / 2 df['hahigh'] = pd.concat([close, open, high], axis=1).max(axis=1) df['halow'] = pd.concat([close, open, low], axis=1).min(axis=1) return df['haclose'], df['haopen'], df['hahigh'], df['halow']
Like TA-Lib's MACD, each column is entered as a return value, and can be used as follows. close, open, high, low = heikinashi(close, open, high, low)
Concluding
You can know it through the formula, but Heikinashi is simply a value that appropriately redefines the average and maximum minimum of candle values. In fact, the noise of existing candles can be reduced by using only moving averages. Even if you combine several moving averages, there are cases where it doesn't seem to be much different from Haikinashi.
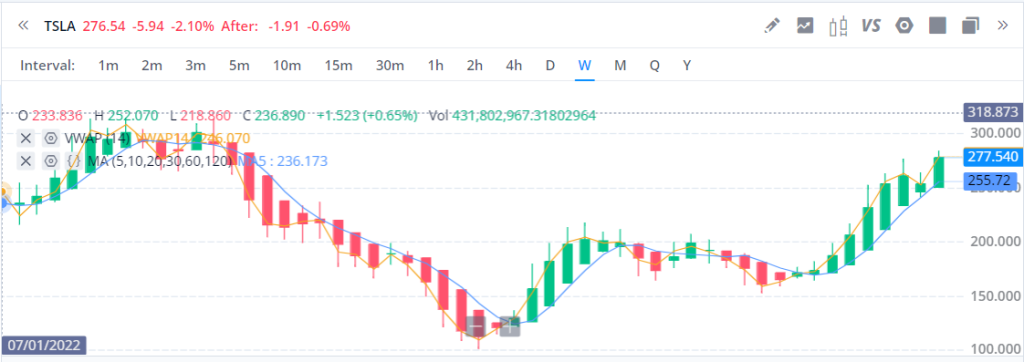 Hikinashi - 5-day moving average + 14-day VWAP
However, just as combining random moving averages does not produce high results, The fact that many people use and study the Hikinashi chart means that This may be proof that it is an appropriate combination.
Even if the Hikinashi chart is not an appropriate ratio for many cases, This is a technique used in various trading such as Trading View, I think it's worth studying at least once.